
|
|
|
|
|
Marshall L. Jacobs, MD [MEDLINE LOOKUP]
Eugene H. Blackstone, MD [MEDLINE LOOKUP]
Leonard L. Bailey, MD [MEDLINE LOOKUP]
The Congenital Heart Surgeons Society

Patients and Methods Results Discussion

Objective: Controversy persists with regard to the treatment of patients with aortic atresia. Staged reconstructive operations and primary transplantation have been advocated as treatment strategies, but in many instances no treatment is undertaken. A multi-institutional study was undertaken for the purpose of characterizing this challenging patient group, comparing the prevalence and outcomes of the various treatment strategies, and identifying potential predictors of success or failure with each. Methods and results: A total of 323 neonates with aortic atresia were entered into a 21-institution prospective, nonrandomized study between January 1, 1994, and January 1, 1997. Three protocols were used, nonexclusively in many institutions: (1) staged reconstructive surgery with initial palliation by a Norwood procedure and eventual Fontan operation, (2) heart transplantation as initial definitive therapy, and (3) nonsurgical management. Analysis was based on initial protocol assignment: staged reconstructive surgery in 253 patients, heart transplantation in 49 patients, and nonsurgical management in 21 patients. For all patients initially entered into the 2 surgical treatment protocols, survival at 1, 3, 12, 24, and 36 months after entry was 67%, 59%, 52%, 51%, and 50%, respectively. A multivariable analysis found incremental risk factors for death at any time after entry to be lower birth weight (P = .04), associated noncardiac anomaly (P = .007), and entry into the nonsurgical protocol (P < .0001) or the staged reconstructive surgery protocol (P = .03). Four institutions had higher survival statistics; 2 used a heart transplantation protocol and 2 used a staged reconstructive surgery protocol. For the 113 patients treated at these 4 institutions, survival at 1, 3, 12, 24, and 36 months after entry was 77%, 70%, 64%, 62%, and 61%, respectively. Survival among the 4 institutions was similar (P = 0.1). Conclusions: Among patients with aortic atresia, other features of cardiac structure including aortic size, degree of left ventricular hypoplasia, and degree of mitral hypoplasia or atresia are not predictive of survival from 2 surgical protocols. The highest survival was achieved with either treatment strategy at institutions strongly committed to the use of one or the other surgical management protocol. (J Thorac Cardiovasc Surg 1998;116:417-31)
Patients
Between January 1, 1994, and January 1, 1997, 323 neonates (age < 30 days) with aortic valve atresia were entered into a prospective study in 21 institutions (Appendix A ![]() ). Two thirds of the patients were aged 2 days or less at admission and 90% were aged 7 days or less. The diagnosis of aortic valve atresia was made in all instances by 2-dimensional echocardiography.
). Two thirds of the patients were aged 2 days or less at admission and 90% were aged 7 days or less. The diagnosis of aortic valve atresia was made in all instances by 2-dimensional echocardiography.
Follow-up
The physician, family, or guardian of each patient not known to be dead was contacted each year since the beginning of the study. The most recent follow-up was conducted from January through March 1997. At that time, 165 patients were known to be dead. During the 1997 follow-up, 149 of the 158 patients not known to be dead were successfully traced. Seven additional patients have follow-up through 1996. Only 2 patients not known to be dead have no follow-up since the time of hospital discharge. Median follow-up time for survivors is 20 months, range 1.1 to 38 months; mean follow-up time for survivors is 21 ± 9.6 months (standard deviation).
Morphology
Estimates of left ventricular size and of the structure and patency of the mitral valve were obtained from echocardiographic reports from the participating institutions. Information regarding associated cardiac anomalies and size of the ascending aorta were obtained from echocardiographic and operative reports.
Protocols
Each patient was entered into 1 of 3 protocols based on initial intention to treat at the participating institution. Thus all patients listed for heart transplantation were considered to have entered the heart transplantation protocol. All patients managed with intent to perform an initial palliative reconstructive operation were considered to have entered the staged reconstructive surgery protocol. Patients who entered into neither surgical treatment protocol were considered to have entered a protocol of nonsurgical management. Analysis was undertaken in relation to intention to treat (initial protocol assignment). Inasmuch as there were a few instances of crossover (from nonsurgical management to either of the treatment protocols or from one surgical treatment protocol to the other), analysis was subsequently undertaken with respect to the event of either Norwood procedure or heart transplant operation.
Data collection and analyses
Copies of all hospital documents were sent to the Data and Analysis Center at the University of Alabama at Birmingham. The data were abstracted into computer files, and these and the copies of the hospital documents were retained in confidential storage. Numerous tabulations, contingency tables, and life table analyses (Kaplan-Meier method) were made. Time-related freedom from death or other outcome events, and the hazard function, were also computed parametrically. Numerous multivariable analyses were made in the time-related hazard function regression domain10; other regression models were used when indicated. All continuous variables were examined as continuous variables (not polytomized). Interaction terms were sought in all multivariable analyses: in equations of this paper, these may be thought of as terms (variables) that are active or inactive only in certain specified relations with other variables. Variables with a P value < .1 were retained in the final equation. Variables used in the multivariable analyses and incremental risk factors for death at any time after entry are listed in Appendix B.![]()
To estimate the proportion of neonates entering each of the two surgical protocols that will achieve definitive repair, a Competing Risks of Events Analysis was performed.11 The mutually exclusive definitive states after entry into the staged reconstructive surgery protocol were as follows: Fontan operation, 2-ventricle repair, crossover to heart transplantation, and death before definitive repair. Those for the heart transplantation protocol were heart transplantation, crossover to a Norwood operation, and death while awaiting transplantation.
Morphology
Of the 323 patients with aortic valve atresia, 309 patients (96%) had severe left ventricular hypoplasia. Of these, 175 patients had mitral atresia, 117 had a patent but stenotic or hypoplastic mitral valve, and 17 patients had unknown mitral valve morphology. Six patients (2%) had a moderate degree of left ventricular hypoplasia, and 8 patients (2.5%) had a normal-sized left ventricle. Of these 8 patients, all but 1 had a nonrestrictive ventricular septal defect. In total, there were 13 patients (4%) with ventricular septal defects of various sizes. The spectrum of cardiac anomalies associated with aortic valve atresia is shown in Table I and associated noncardiac anomalies in Table II.
| Associated cardiac anomaly | n | Total deaths | ||
| No. | % | 70% CL (%) | ||
| Position cardiac anomaly | ||||
| Dextrocardia | 1 | 0 | 0 | 0-85 |
| Atrial anomalies | ||||
| Intact atrial septum | 13 | 8 | 62 | 43-77 |
| Left juxtaposition of atrial appendages | 1 | 1 | 100 | 15-100 |
| Cortriatriatum dexter | 1 | 1 | 100 | 15-100 |
| Anomalies of right ventricular outflow | ||||
| Bicuspid pulmonary valve | 4 | 2 | 50 | 18-82 |
| Pulmonary valve stenosis (mild) | 3 | 1 | 33 | 4-76 |
| Anomalies of coronary circulation | ||||
| LVcoronary artery fistula | 8 | 5 | 62 | 38-83 |
| Single coronary orifice | 4 | 4 | 100 | 62-100 |
| LAD arising from RCA | 1 | 0 | 0 | 0-85 |
| Origin of CCX from RPA | 1 | 1 | 100 | 15-100 |
| Cardiac rhythm disturbance | ||||
| Wolff-Parkinson-White syndrome | 1 | 0 | 0 | 0-85 |
| Anomalies of the aorta | ||||
| Aberrant origin of right subclavian artery | 11 | 1 | 9 | 1-28 |
| Interrupted aortic arch | 1 | 0 | 0 | 0-85 |
| Unusual aortic branching pattern | 1 | 0 | 0 | 0-85 |
| Aneurysm of transverse arech and descending thoracic aorta | 1 | 1 | 100 | 15-100 |
| Right aortic arch passing retroesophageally to left-sided descending thoracic aorta | 1 | 1 | 100 | 15-100 |
| Anomalies of systemic venous connection | ||||
| Bilateral SVC | 28 | 11 | 39 | 29-51 |
| Unroofed coronary sinus* | 5 | 4 | 80 | 47-97 |
| Left SVC to left atrium | 1 | 0 | 0 | 0-85 |
| Left atrium to systemic venous channels | 4 | 2 | 50 | 18-82 |
| Anomalies of pulmonary venous conection/drainage | ||||
| Partial! | 9 | 3 | 33 | 15-56 |
| Total § | 3 | 2 | 67 | 24-96 |
| Aortopulmonary collaterals | 1 | 1 | 100 | 15-100 |
LV,Left ventricle; LAD, left anterior descending;RCA, right coronary artery;CCX, circumflex coronary artery; RPA,right pulmonary artery; SVC, superior vena cava; CL, confidence limits. * Intact atrial septum in 3. Intact atrial septum in all. ! Intact atrial septum in 1. § Intact atrial septum in 1. |
||||
| Associated noncardiac anomaly | n | Total deaths | ||
| No. | % | 70% CL (%) | ||
| Turners syndrome | 7 | 6 | 86 | 59-98 |
| Alagilles syndrome | 1 | 1 | 100 | 15-100 |
| Chromosome 15 anomaly | 1 | 1 | 100 | 15-100 |
| Charge association | 1 | 1 | 100 | 15-100 |
| Langer-Giedion syndrome | 1 | 1 | 100 | 15-100 |
| DiGeorge syndrome | 1 | 1 | 100 | 15-100 |
| Cystic fibrosis | 1 | 1 | 100 | 15-100 |
| Microencephaly | 3 | 2 | 67 | 24-96 |
| Severe diffuse CNS dysfunction | 1 | 1 | 100 | 15-100 |
| Unspecified CNS abnormality | 1 | 1 | 100 | 15-100 |
| Transesophageal fistula with esophageal atresia | 2 | 2 | 100 | 39-100 |
| Imperforate anus | 1 | 1 | 100 | 15-100 |
CNS, Central nervous system; CL,confidence limits. |
||||
Survival
For all 323 patients, survival at 1, 3, 12, 24, and 36 months after entry was 63%, 55%, 50%, 48%, and 47%, respectively (Fig. 1, A).
| Fig. 1. Non-risk-adjusted survival and hazard function for death for all 323 patients in the study. A, Survival after entry (at time zero). Each circle represents an actual death, positioned at the time of death along the horizonal axis and actuarially along the vertical axis. The vertical bars depict ± 1 standard error. The numbers indicate the number of patients remaining at risk at the time of the estimate. The solid line is the parametric estimate of survival, and the dashed lines enclose the 70% confidence intervals. B, Hazard function for death. |
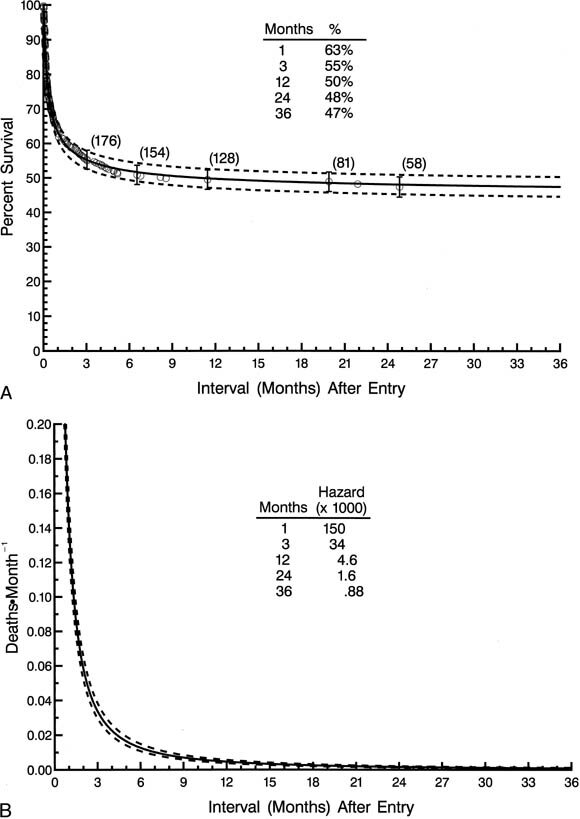 |
The single phase of hazard was a rapidly declining one, but an appreciable instantaneous risk of death was still present 12 months after entry (Fig. 1, B![]() ). As stated, numerous patient factors, protocol or procedure factors, and experience factors were used in multivariable analyses to identify risk factors for (correlates of) death at any time after entry. Among demographic and morphologic factors, those identified as risk factors for death at any time after entry include lower birth weight (P = .04), nonwhite race (P = .02), and the presence of an associated noncardiac anomaly (P = .007). None of the features of cardiac morphology analyzed, including ascending aortic size, degree of left ventricular hypoplasia, and degree of mitral hypoplasia or atresia, were predictive of survival.
). As stated, numerous patient factors, protocol or procedure factors, and experience factors were used in multivariable analyses to identify risk factors for (correlates of) death at any time after entry. Among demographic and morphologic factors, those identified as risk factors for death at any time after entry include lower birth weight (P = .04), nonwhite race (P = .02), and the presence of an associated noncardiac anomaly (P = .007). None of the features of cardiac morphology analyzed, including ascending aortic size, degree of left ventricular hypoplasia, and degree of mitral hypoplasia or atresia, were predictive of survival.
Of the 21 participating institutions, 9 institutions entered patients into more than 1 protocol, including 4 institutions that used both surgical treatment protocols (Table III).
| Institution | n | Protocol | |||||
| No treatment | Staged reconstruction | Transplant | |||||
| No. | % | No. | % | No. | % | ||
| R | 36 | 3 | 8 | 33 | 92 | ||
| H | 20 | 1 | 5 | 19 | 95 | ||
| C | 11 | 8 | 73 | 3 | 27 | ||
| N | 56 | 56 | 100 | ||||
| J | 51 | 51 | 100 | ||||
| P | 12 | 12 | 100 | ||||
| F | 11 | 11 | 100 | ||||
| D | 9 | 9 | 100 | ||||
| K | 5 | 5 | 100 | ||||
| S | 3 | 3 | 100 | ||||
| U | 4 | 4 | 100 | ||||
| G | 3 | 3 | 100 | ||||
| A | 2 | 2 | 100 | ||||
| T | 2 | 2 | 100 | ||||
| B | 1 | 1 | 100 | ||||
| O | 15 | 2 | 13 | 13 | 87 | ||
| E | 14 | 3 | 21 | 11 | 79 | ||
| I | 24 | 23 | 96 | 1 | 4 | ||
| M | 5 | 4 | 80 | 1 | 20 | ||
| L | 25 | 3 | 12 | 1 | 4 | 21 | 84 |
| Q | 14 | 1 | 7 | 11 | 79 | 2 | 14 |
| Total | 323 | 21 | 7 | 253 | 78 | 49 | 16 |
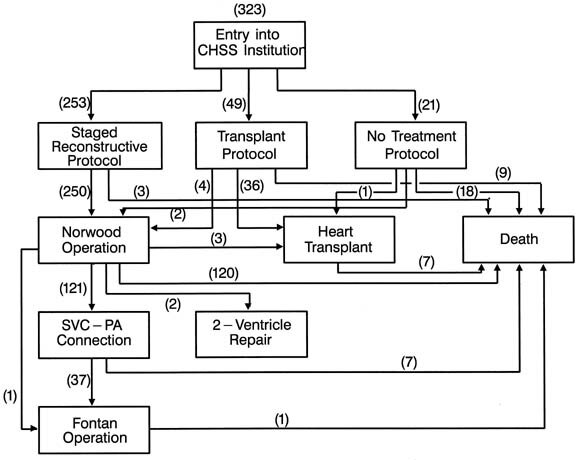
| Fig. 2.Schematic diagram of the treatment pathway and fate of the 323 patients after initial protocol assignment. SVC-PA, Superior vena cavapulmonary artery. |
 |
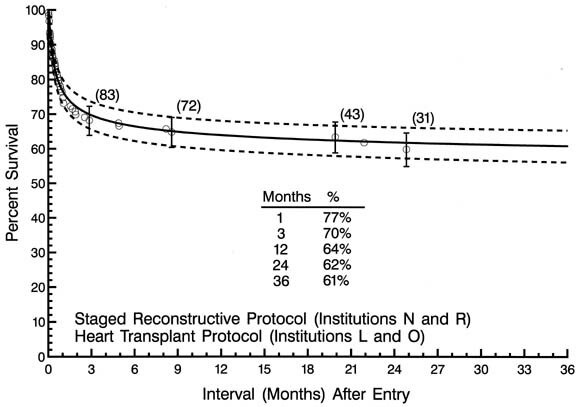
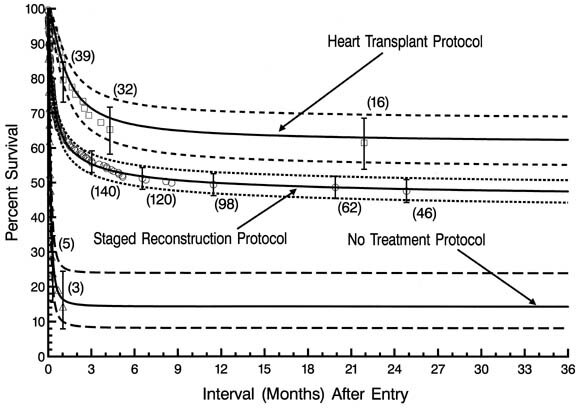
In comparing protocols, the likelihood of death at any time after entry was higher for patients in the no treatment protocol (P < .0001) or the staged reconstructive surgery protocol (P = .03) than for those in the transplantation protocol. Four institutions were identified as having higher survival than the rest (lower risk of death at any time after entry), P < .05. Two of these institutions used the staged reconstructive surgery protocol and 2 the heart transplantation protocol. For the 113 patients treated at these 4 institutions, survival at 1, 3, 12, 24, and 37 months after entry was 77%, 70%, 64%, 62%, and 61%, respectively (Fig. 3).
| Fig. 3. Non-risk-adjusted survival for patients treated at the 4 low-risk institutions. |
 |
Staged reconstructive surgery protocol
The 253 patients entered into a staged reconstructive surgery protocol were distributed among 19 different institutions, with 3 institutions accounting for 140 (55%) of the patients and with half of the institutions each accounting for 5 patients or fewer. Time-related survival among the 253 patients entered into the staged reconstructive surgery protocol is depicted in Fig. 4, A.
| Fig. 4. Non-risk-adjusted survival and hazard function for patients (n = 253) initially entered in the staged reconstructive surgery protocol. A, Survival after entry (at time zero). B, Hazard function for death. |
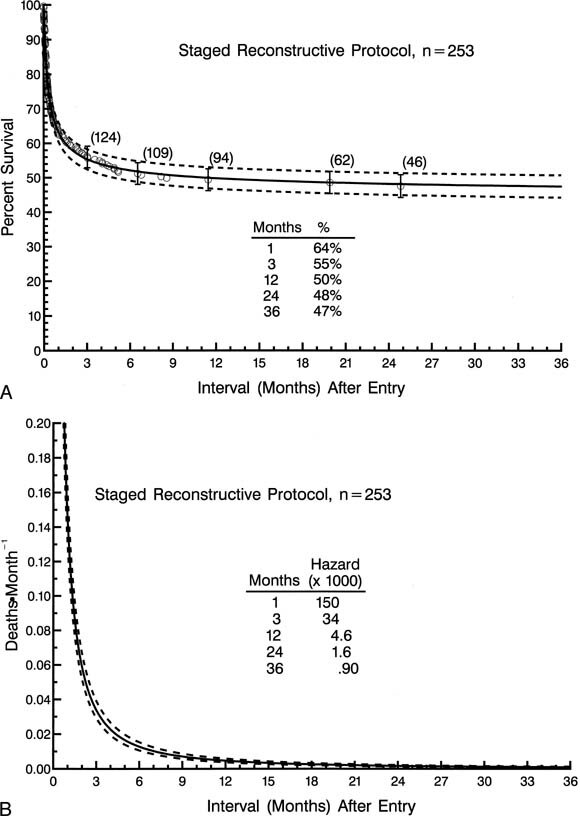 |
The hazard function for death has only a single declining phase with a sharp change in the rate of decline (inflection) at about 4 months after entry (Fig. 4, B![]() ). For patients entered into the staged reconstructive surgery protocol, incremental risk factors for death at any time after entry (multivariable analysis) include lower birth weight and associated noncardiac anomalies. More recent date of entry tended to be associated with a higher risk of mortality (P = .09). Two institutions were identified as negative risk factors for death at any time after entry. However at each of these 2 low-risk institutions, more recent date of admission was associated with a higher risk of mortality (P < .05).
). For patients entered into the staged reconstructive surgery protocol, incremental risk factors for death at any time after entry (multivariable analysis) include lower birth weight and associated noncardiac anomalies. More recent date of entry tended to be associated with a higher risk of mortality (P = .09). Two institutions were identified as negative risk factors for death at any time after entry. However at each of these 2 low-risk institutions, more recent date of admission was associated with a higher risk of mortality (P < .05).
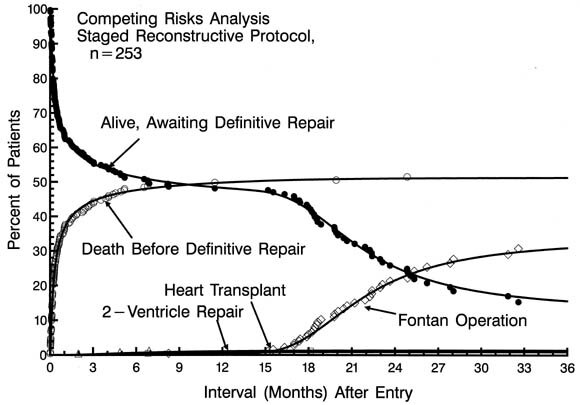
Of patients managed initially with a first-stage Norwood procedure, 121 patients have subsequently undergone a superior vena cavapulmonary artery anastomosis (bidirectional Glenn or hemi-Fontan procedure) at a median age of 6.4 months. Thirty-eight have thus far undergone a completion Fontan operation at a median age of 20 months. Fig. 5 depicts a Competing Risks Analysis of the various events after initial enrollment in the staged reconstructive surgery protocol.
| Fig. 5.Competing Risks Analysis for patients in the staged reconstructive surgery protocol (n = 253). The number of patients (expressed as a percent of total) in each of 5 categories across the time of follow-up is depicted. All patients begin alive, awaiting definitive repair. Thereafter, patients migrate to death, the Fontan operation, heart transplantation, and 2-ventricle repair according to the respective hazard functions operating on those remaining alive, awaiting definitive repair. At every point in time, the number of patients in all categories adds to 100% (so-called conservation of patients). Symbols represent each event, positioned on the vertical axis by multiple decrement analysis. The solid curves represent mathematical estimates of the accumulative effect of the 4 hazard functions operating on the original group of patients. |
 |
Transplantation protocol
The 49 patients entered into a heart transplantation protocol were distributed among 6 different institutions, with 3 institutions accounting for 45 (92%) of the patients. Time-related survival among the 49 patients entered into a heart transplantation protocol is depicted in Fig. 6, A.
| Fig. 6.Non-risk-adjusted survival and hazard function for death for patients (n = 49) initially entered in the heart transplant protocol. A, Survival after entry (at time zero). B, Hazard function for death. |
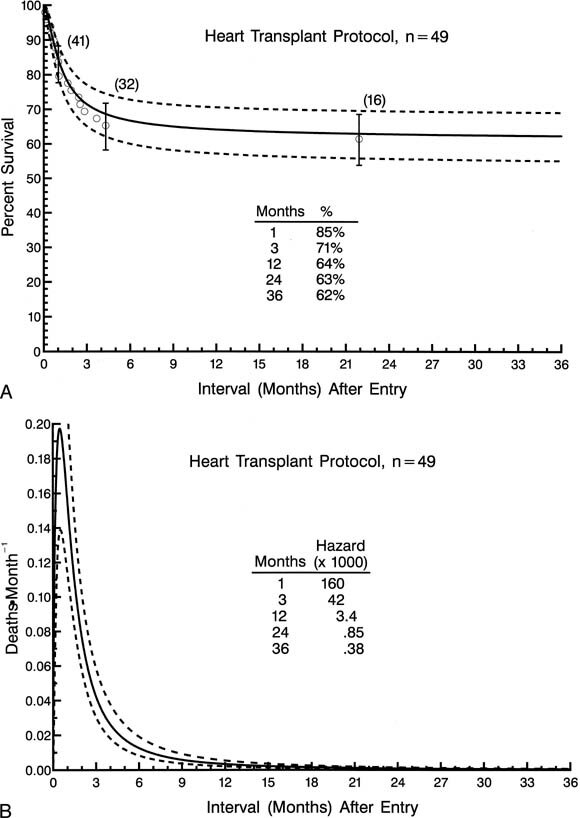 |
The hazard function for death has only a single declining phase with a change in the rate of decline (inflection) at 4 to 5 months (Fig. 6, B![]() ). For patients entered into the heart transplantation protocol, incremental risk factors for death at any time after entry included lower birth weight and nonwhite race. Of the 3 institutions accounting for most of the patients in the heart transplantation protocol, 2 were identified as having higher survivals for patients in the heart transplantation protocol than the others. These 2 centers together accounted for 34 patients in the heart transplantation protocol and for 5 patients in the nonsurgical protocol.
). For patients entered into the heart transplantation protocol, incremental risk factors for death at any time after entry included lower birth weight and nonwhite race. Of the 3 institutions accounting for most of the patients in the heart transplantation protocol, 2 were identified as having higher survivals for patients in the heart transplantation protocol than the others. These 2 centers together accounted for 34 patients in the heart transplantation protocol and for 5 patients in the nonsurgical protocol.
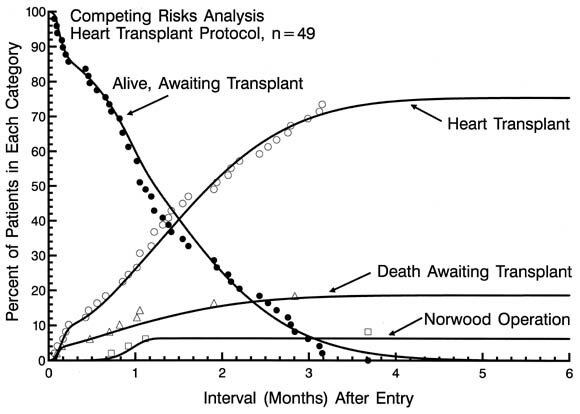
Of the total of 49 patients initially entered into the heart transplantation protocol, 36 underwent heart transplantation. Four patients crossed over to reconstructive surgery and underwent a first-stage Norwood procedure (with 2 survivors) and 1 was removed from the transplant list and died. Eight others died awaiting transplantation. Fig. 7 depicts a Competing Risks Analysis of the various events after initial enrollment in the heart transplantation protocol.
| Fig. 7.Competing Risks Analysis for patients (n = 49) initially entered into the heart transplant protocol. The number of patients (expressed as a percent of total) in each of 4 categories across the time of follow-up is depicted. All patients begin alive, awaiting transplantation. Thereafter, patients migrate to heart transplantation, death awaiting transplantation, and Norwood operations according to the respective hazard function. The depiction is otherwise as in Fig. 5. |
 |
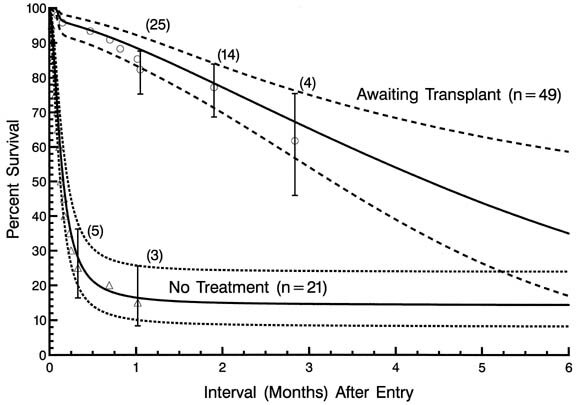
That the altered natural history of patients receiving supportive care in anticipation of eventual transplantation is markedly different from the natural history of the disease itself is illustrated in Fig. 8, depicting non-risk-adjusted survival of patients awaiting transplantation and of those in the nonsurgical treatment protocol.
| Fig. 8.Non-risk-adjusted survival for patients awaiting transplantation in the heart transplantation protocol, and for patients in the no surgical treatment protocol. |
 |
Protocol comparisons
Non-risk-adjusted survival at any time after entry was higher for patients in the heart transplantation protocol than for those in the staged reconstructive surgery protocol (Fig. 9). Time-related survival was by far lowest in the nonsurgical protocol, with all survival accounted for by protocol crossovers.
| Fig. 9. Actuarial (life-table) survival of patients stratified according to the 3 treatment protocols. Each symbol represents an actual death, positioned at the time of death along the horizontal axis and actuarially along the vertical axis. The vertical bars depict ± 1 standard error. The numbers indicate the number of patients remaining at risk at the time of estimate. The solid lines are the parametric estimates of survival, and the dashed lines enclose the 70% confidence intervals. |
 |
Each of the 4 low-risk institutions made virtually exclusive use of one or the other of the 2 surgical treatment protocols. Three of the 4 institutions also entered a total of 5 patients into a nonsurgical treatment protocol. To characterize the outcome of surgical treatment at a low-risk institution, and to determine whether an optimal treatment protocol could be identified, the survival of patients managed in the respective surgical treatment protocols at these 4 institutions was compared (Fig. 10, A).
| Fig. 10.A, Non-risk-adjusted survival of patients entered into treatment protocols at the 4 low-risk institutions. The 70% confidence intervals converge at a point approximately 1 week after entry and continue to overlap thereafter. B, Survival of patients initially entering either surgical treatment protocol at the 4 low-risk institutions is shown, together with results at the remaining institutions. Patients for whom the nonsurgical protocol was initially designated are excluded from this analysis. |
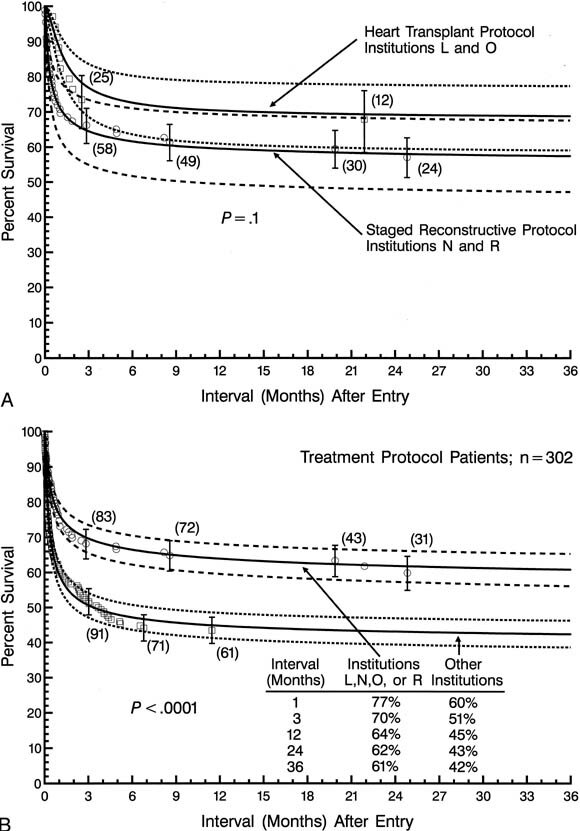 |
Despite the use of the 2 different surgical protocols, the difference in survival statistics among the 4 institutions was not more than could be due to chance alone (P = .1 ), with 70% confidence limits converging at an interval of approximately 1 week after entry. Survival at 1, 3, 12, 24, and 36 months after entry was 77%, 70%, 64%, 62%, and 62%, respectively, for patients treated at the 4 low-risk institutions. These results using the 2 treatment protocols at the 4 low-risk institutions are also compared with corresponding results at the remainder of the institutions (Fig. 10, B![]() ).
).
Critique of the study
This study has the advantage of having enrolled 323 neonates with a single diagnosis in 3 years (enrollment and annual follow-up continue). Most of the previous studies originating from individual institutions report the results of treatment of considerably smaller patient groups. Among those institutions having reported on experience with large volumes of patients, virtually all have contributed to this multi-institutional study.12,16 The majority of previous reports focus on the outcome of a particular operative strategy (ie, either the Norwood operation or orthotopic heart transplantation) and, in most instances, are reflective of the management of a heterogeneous patient group in that they describe the management and outcomes of patients with hypoplastic left heart syndrome or lesions resembling this syndrome. By limiting the analysis to those patients with aortic valve atresia, we have hoped to shed light on the influence of treatment strategy on a more anatomically and physiologically homogeneous patient population. Nevertheless, the study has limitations. No attempt was made to prospectively randomize management protocols. As such, the selection of protocols and therefore the inferences that can be made concerning results may to some extent still be influenced by individual institutional biases.
Study design did not enable us to ascertain whether there are anatomic, morphologic, or other patient characteristics which for this specific cardiac anomaly would mitigate for a higher likelihood of survival with one or the other of the surgical treatment strategies. It has been speculated, for example, that this may be true with regard to either severe tricuspid valve incompetence or pulmonary venous obstruction resulting from intact atrial septum or anomalies of pulmonary venous return. Although these last 2 were among the associated cardiac anomalies included in the multivariable analyses, their relatively low prevalence together with the overall mortality of approximately 50% may have led to an underestimate of their potential importance.
The study is also limited by our current inability to identify and analyze any late-phase events associated with either of the treatment strategies. Certainly a consideration of the late-phase events after creation of the Fontan-type circulation (eg, ventricular dysfunction, arrhythmias, protein-losing enteropathy) and those after transplantation (eg, late rejection, lymphoproliferative disease, graft atherosclerosis) is essential to the overall comparison of surgical treatment strategies for aortic atresia. Additionally, the majority of patients enrolled in the reconstructive surgical protocol have yet to undergo a definitive repair (Fontan operation), although to date mortality for the second- and third-stage procedures has been low. It should be possible, after a longer period of follow-up of this patient cohort, to know more about the relative efficacy of treatment strategies.
Inferences as to therapy
For neonates with aortic atresia, supportive medical therapy (as applied in anticipation of transplantation as initial and definitive therapy) results in a drastic alteration of the adverse natural history associated with the lesion itself. As such, it is possible that the application of the same principles of supportive therapy to all patients in anticipation of either transplantation or palliative reconstructive surgery might favorably affect overall survival. Although the interval between entry and procedure was among those factors analyzed in the multivariable analyses and was not found to be predictive of survival, 75% of the patients who underwent a Norwood operation did so by 8 days of age, whereas the median age for heart transplantation was 1.9 months. The experience of the transplant centers is supportive of the inference that the majority of patients can be successfully stabilized and supported for a period of time, obviating the necessity for early emergency surgery in most instances. It would be of interest to explore the hypothesis that an additional period of medical stabilization and supportive therapy might favorably affect the outcome of initial palliative reconstructive surgery.
It was not uniformly the case that every high-volume center was among the low-risk institutions. At the same time, the nearly exclusive use of one or the other of the 2 surgical treatment protocols at each of the 4 low-risk institutions suggests that a strong institutional commitment to a particular therapeutic strategy is a principal ingredient of intermediate-term success. At the present time, survival of neonates with aortic atresia managed by either of the 2 surgical treatment protocols at a low-risk institution is slightly greater than 60% at 2 years. This is not importantly lower than the likelihood of survival for patients with some of the other challenging congenital heart malformations that require initial surgical interventions during the newborn period.17,18 This study was intentionally limited to an examination of survival after initial neonatal management of aortic atresia. Additional follow-up and further analyses of this relatively large patient group may further enhance our ability to optimize the medical and surgical management of patients with this challenging cardiac malformation.
The 21 institutions, in randomly determined order, participating in this study of the Congenital Heart Surgeons Society.
Mott Childrens Hospital, Ann Arbor, MI; The University of Alabama at Birmingham, Birmingham, AL; The Childrens Hospital, Boston, MA; The Childrens Hospital of Buffalo, Buffalo, NY; Childrens Memorial Hospital, Chicago, IL; The University of Chicago, Chicago, IL; Childrens Hospital Medical Center, Cincinnati, OH; The Childrens Hospital, Denver, CO; The Childrens Hospital of Michigan, Detroit, MI; Duke University Medical Center, Durham, NC; The Milton S. Hershey Medical Center, Hershey, PA; Loma Linda University Medical Center, Loma Linda, CA; The Childrens Hospital of Los Angeles, Los Angeles, CA; Jackson Memorial Hospital, Miami, FL; Columbia-Presbyterian Medical Center, New York, NY; The Childrens Memorial Hospital, Omaha, NB; The Childrens Hospital of Philadelphia, Philadelphia, PA; University of Pittsburgh Childrens Hospital, Pittsburgh, PA; The Mayo Clinic, Rochester, MN; The Hospital for Sick Children, Toronto, ON, Canada; Georgetown University Medical Center, Washington, DC.
| Patient |
| Demographic:Age (days) at entry, gestation (weeks), birth weight (kg), gender (male, female), race (white, African-American, Hispanic, other), weight at entry (kg), height at entry (cm), body surgace area at entry (m2), prenatal diagnosis |
| Morphologic:Mitral stenosis (vs atresia), size (Z-value) of ascending aorta, left ventricularcoronary artery fistulas, presence and size of ventricular septal defect, anomalous origin of right subclavian artery, anomalous pulmonary venous connection, intact atrial septum, important noncardiac congenital anomaly |
| Management: Treatment protocol determined at entry (intent-to-treat) |
| Experience |
| Date of entry, individual institution, identifier, individual surgeon identifier |
| Procedure (when time zero is the time of an operation) |
| Dmographic: Age at procedure, interval between entry and procedure, interval between listing and transplantation (for heart transplantation) |
| Norwood operation: More-or-less classic Norwood, modified Norwood (augmentation with descending aorta, end-to-end aortapulmonary artery anastomosis with ascending aortic implant), size of systemic-pulmonary shunt (in mm, and normalized to body surface area and weight) |
| Support: Total circulatory arrest time (min), myocardial ischemic time (min) (includes storage time for transplanted hearts) |
| Surgical experience (when time zero is the time of an operation) |
| Date of procedure, individual institution identifier, individual surgeon identifier |
| Incremental risk factors for death after entry: Patient factors only | Single hazard phase | |
| Coefficient ± SD | P value | |
| Patient | ||
| Birth weight * (lower) | 0.0526 ± 0.025 | .04 |
| African American or Hispanic ethnicity | 0.494 ± 0.20 | .02 |
| Left superior vena cava | 0.541 ± 0.31 | .08 |
| Associated noncardiac anomaly | 0.728 ± 0.27 | .007 |
| Intercept | 0.270 | |
 =0, =0,  = 0.436, = 0.436,  =1.85; m=0. =1.85; m=0.*(Birth weight [kg])2 squared transformation. |
||
| Incremental risk factors for death after entry: Protocols only | Single hazard phase | |
| Coefficient ± SD | P value | |
| Protocol | ||
| No treatment protocol | 1.87 ± 0.34 | <.0001 |
| Staged reconstructive surgery protocol | 0.539 ± 0.25 | .03 |
| Intercept | 0.740 | |
| =0, = 0.397, =1.81; m=0. |
||
| Incremental risk factors for death after entry: Patient and protocol factors | Single hazard phase | |
| Coefficient ± SD | P value | |
| Patient | ||
| Birth weight* (lower) | 0.0577 ± 0.025 | .02 |
| African American or Hispanic ethnicity | 0.483 ±0.21 | .02 |
| Left ventriclecoronary artery fistulas | 0.876 ± 0.46 | .06 |
| Left superior vena cava | 0.538 ±0.32 | .09 |
| Associated noncardiac anomaly | 0.533 ± 0.27 | .05 |
| Protocol | ||
| No treatment protocol | 1.83 ± 0.34 | <.0001 |
| Staged reconstructive surgery protocol | 0.629 ± 0.26 | .01 |
| Intercept | 0.234 | |
| =0, = 0.436, =1.85; m=0. |
||
| Incremental risk factors for death after entry: Patient, protocol and experience factors | Single hazard phase | |
| Coefficient ± SD | P value | |
| Patient | ||
| Birth weight* (lower) | 0.595 ± 0.026 | .02 |
| African American or Hispanic ethnicity | 0.707 ± 0.21 | .0008 |
| Left ventriclecoronary artery fistulas | 0.984 ± 0.47 | .04 |
| Left superior vena cava | 0.603 ± 0.32 | .06 |
| Associated noncardiac anomaly | 0.933 ± 0.28 | .0009 |
| Protocol | ||
| No treatment protocol | 2.06 ± 0.36 | <.0001 |
| Staged reconstructive surgery protocol | 1.12 ± 0.30 | .0002 |
| Experience | ||
| Institution E | 0.995 ± 0.40 | .01 |
| Institution N | 0.937 ± 0.36 | .009 |
| And (later) date of admission | 0.154 ± 0.074 | .04 |
| Institution R | 0.946 ± 0.53 | .07 |
| And (later) date of admission | 0.603 ± 0.26 | .02 |
| Intercept | 0.590 | |
| =0, = 0.502, =1.91; m=0. *(Birth weight [kg])2 squared transformation. (Years since January 1, 1994)2 squared transformation. |
||

Copyright © 1998 by Mosby, Inc.